Office of Sustainability 2022
The Problem
Excessive waste contamination and improper sorting has caused the UCSF Medical Centers to be fined around $7,000 a month for exceeding the Recology maximum allowable contamination of waste, being 25% contamination of landfill, 10% recycling, and 5% compost. Specifically, the contamination of the recycling stream is the main cause of these fines. The elevator landing recycling and landfill bins in the Long and Moffitt towers of Parnassus Medical Center are areas of improvement in terms of waste contamination. They currently do not uniformly have lids or simple signage, leading to frequent contamination. Given that the elevator landings are a public space, including visits from patients and their families, we cannot simply host team trainings to address the issue.
Purpose
The purpose of the pilot program is to reduce the contamination of the recycling and landfill bins in the elevator landing areas. Specifically, to reduce the contamination of the recycling to below the 10% threshold standard of Recology. A co-benefit of implementing this pilot program is to promote that UCSF Health cares about recycling and sustainable initiatives.
Strategy Selected
In order to address the elevator landing contamination, the strategy proposed is to implement new signage and lids (when applicable, as some bins have metal casings) to the recycling bins.
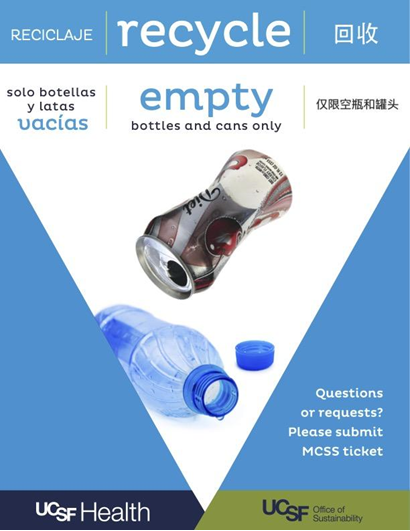
- Changing the recycling signage to say, “empty bottles and cans only,” and to have images of only empty bottles and cans will help prevent recycling contamination with landfill items, and to limit the number of bottles and cans that end up in the trash.
- Limiting recycling to only bottles and cans will reduce confusion about if other plastics or paper products are recyclable, reducing the contamination.
- Simplifying the signage to minimal words and pictures will increase the understandability, as well as the likelihood that the signs will be read.
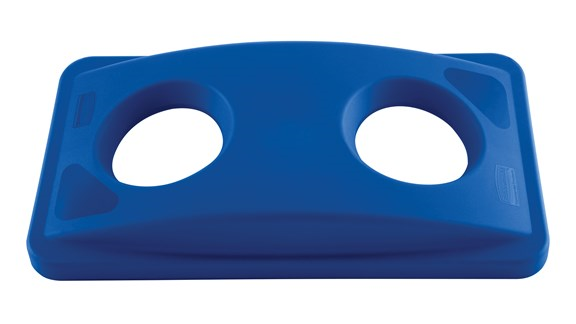
- Adding bottle and can lids to the recycling to ensure only bottles and cans go into the recycling.
A smaller opening and shaped lid will make people think about sorting while they are tossing waste, regardless of whether or not they read the signage.
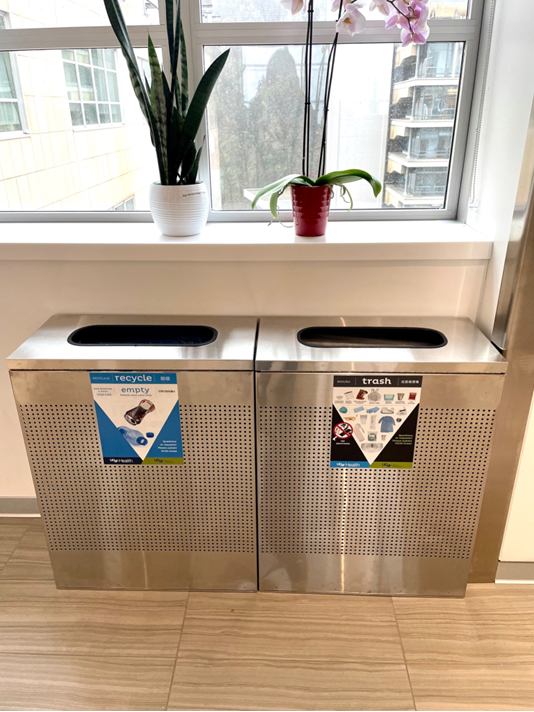
 Recycling signage with bottles and cans.
 New bottles and can only lid.
Constraints
- Bins get moved frequently or go missing.
- Bins can't be uniformly next to each other due to space availability on floors.
- Sign location is not consistent: sometimes signage is on the wall, sometimes on the bin, and sometimes on a sign holder.
- Some bins have stainless steel casings making lids unable to be implemented.
Objective of Pilot Program
To determine if new signage and lids helps to reduce the recycling and landfill contamination in the elevator landing areas.
Implementation Process
Number of units tested:
2 towers and 16 floors totaling 31 landfill and recycling each (no public waste stations on floor 2 of Long tower).
- Reach out to custodial team informing them about the new changes.
- Ask if they are okay with the change in workflow: having to remove the bin lids.
- Ask about when the bins get emptied.
- Bins are pulled daily during each shift (AM, PM, NOC).
- Preferably do audits when the bins haven’t recently been emptied.
- Complete control waste audits using waste auditing app Zabble.
- Timeline:
- 2-3 times a week, 6 audits total, 2 with trash grabber
- Long
- 1st 10/18
- 2nd 10/21
- 3rd 10/25
- 4th 10/26
- 5th 10/28
- 6th 10/31
- Moffitt
- 1st 10/19
- 2nd 10/25
- 3rd 10/26
- 4th 10/28
- 5th 10/31
- 6th 11/2
- Implement new signage and lids to the elevator landing bins.
- Complete waste audits after implementation via Zabble.
- Timeline: 2-3 times a week, 6 audits total, 2 with trash grabber
- 1st: 11/21
- 2nd: 11/28
- 3rd: 12/1
- 4th: 12/5
- 5th: 12/7
- 6th: Long 12/19
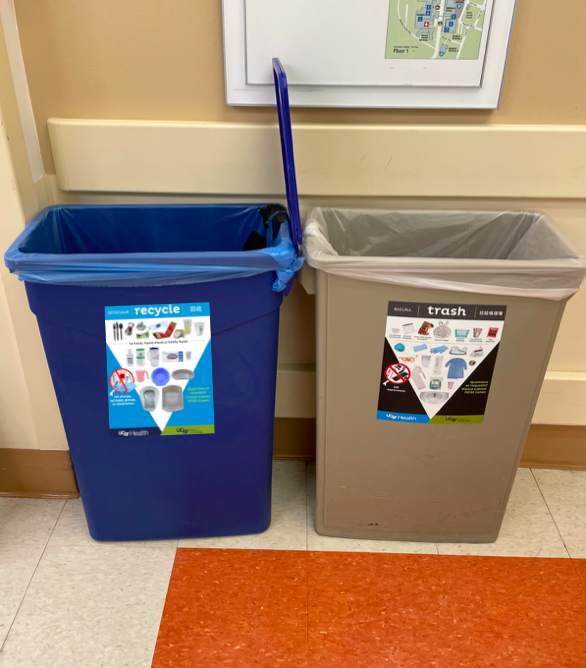 Elevator landing waste station before changes
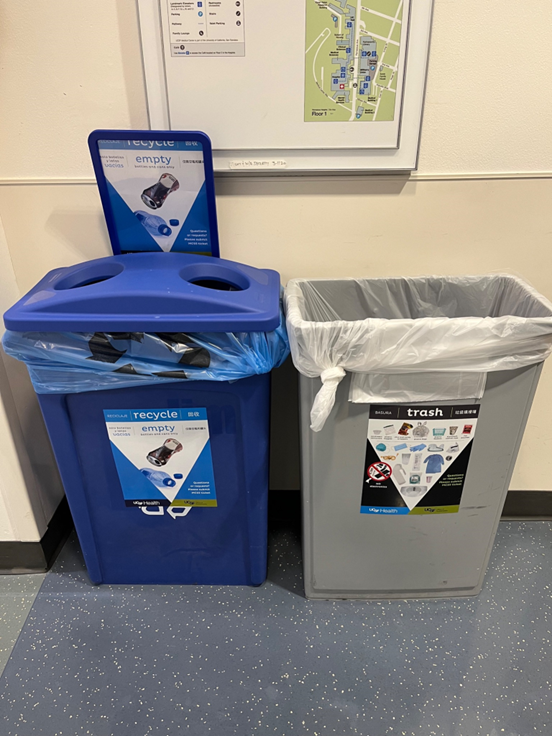 Elevator landing waste station after changes
Metrics of Success
Audits done at varying times afterwards will help determine if there was a spike in diversion after the pilot program was implemented, and to see if the increase in diversion is retained. If contamination levels on average amongst all the floors go down, the pilot program will be considered successful. Details of contamination diversion based on audits are visible on the Zabble dashboard. This includes the average contamination percentage amongst all the floors.
Next Steps
If the pilot program proves to be successful, the next step would be to look into standardizing the bins across all floors. Some of the bins have stainless steel metal casings (Moffitt 15, 14, 11, 10, 3, and 1 and Long 13 and 11 ), preventing the new bottles and cans lids from being implemented. If there is a significant decrease in the waste contamination of the bins that received the new lids, versus the bins that had metal casings, it will be discussed with the hospitality department about the possibility of removing the metal casings. Another next step to be taken if the metal cased bins show more contamination than the bins with the bottles and cans lids is to suggest not having metal casings for the New Hospital being built at Parnassus Heights.
Results
The results of the control audits showed that the baseline recycling contamination percent was 43%, landfill contamination was 8%, with the overall contamination being 25%. After implementing the waste sustainability changes, the endline recycling contamination dropped to 24%. Landfill contamination increased to 15%, with overall contamination being 19%. An increase of landfill contamination was expected, given that we were limiting items that could go into the recycling bins. Although the recycling contamination didn’t drop to 10%, a drop to 24% from 43% is still very impressive. Additionally, since overall contamination dropped from 25% to 19%, adding new signage and bottles and cans lids proves to be helpful at reducing waste stream contamination.
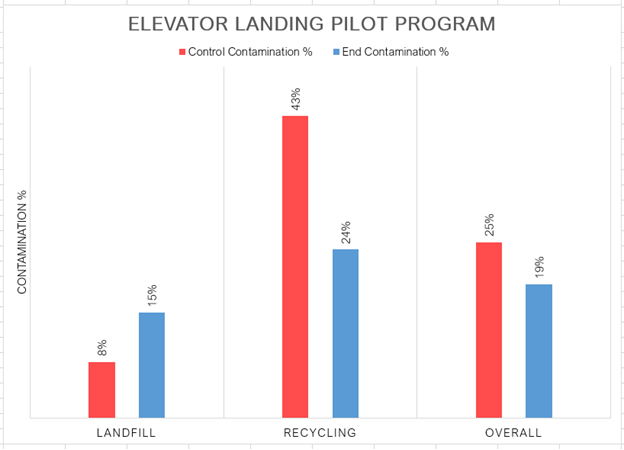 Elevator landing contamination audit results graph.
When looking at what items contribute to contamination, the control audits showed that the landfill had 64 instances of bottles, cans, or cups before adding the new lids and signs. After adding the changes, the landfill had 59 instances of bottles, cans, or cups. This indicates that instead of capturing more bottles and cans from the landfill bin, the new lids and signs helped to keep landfill items out of the recycling bins. The endline audits showed that the remaining 24% contamination in the recycling bins is primarily made up of paper towels, PPE, and plastic film. Those were the main contributors to recycling contamination in the control audits as well, suggesting that the contamination results from people tossing waste without reading the signs or stopping to think about sorting.
When looking at bin types, specifically slim jims that allowed for new lids to be added, versus the metal cased bins that could not receive new lids, there were differences in the drop of contamination percentages. Before adding new signs and lids, slim jims had a recycling contamination of 53% and landfill contamination of 7%, whereas the metal cased bins had a recycling contamination of 50% and landfill contamination of 11%. The endline audits showed that after adding the waste sustainability changes, the slim jims had a recycling contamination of 27% and landfill contamination of 24%, whereas the metal cased bins had a recycling contamination of 43% and landfill contamination of 19%. This indicates that using slim jims with new signage and lids reduces waste stream contamination more than bins in metal casings with just new signage.
 Elevator landing waste station with metal casing
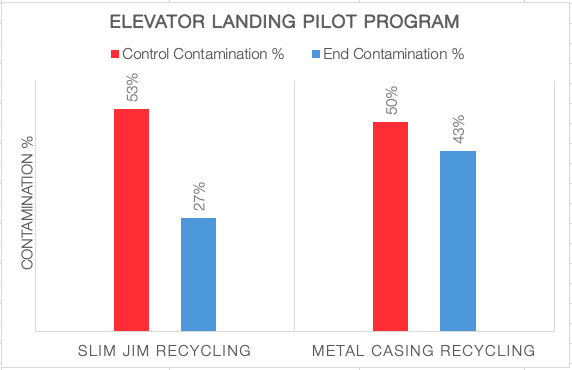 Elevator landing metal casing versus slim jim audit results graph
